Blog 1

Random Talk on Random Thoughts

Some Families of Open Sets in $\Bbb R$

| Comments |

Two days ago, I read a proof about a basic property of open sets in Royden’s Real Analysis. It says that each open set in $\Bbb R$ is a countable union of disjoint open intervals. Reading the book, I got stuck at the countability. I tried to think of a map between each open interval and a rational number, but I didn’t know which one to choose. It took me half an hour to understand from the words that the one single rational number inside the open interval can be arbitrarily chosen.

Yesterday, I was puzzled at $\mathcal{T} \subseteq \mathcal{B}$ for a while. On the LHS, I came up with “arbitrary union”; on the RHS, I thought of “countable union”. It seemed that “countable union” is more restrictive than “arbitrarily union”. My teacher said that this is by definition, and I realized that I forgot the definition of Borel sets. He thought that I didn’t know $\mathcal{T}_\sigma = \mathcal{T}$. Finally, I get it.
Improve Efficiency of Inner Join

| Comments |

Background

I search the data on Stack Exchange Data Explorer.

Problem

I want to select columns from two tables and join them to form one single table. I choose INNER JOIN to avoid seeing null entries in the result. The syntax is similar to the following.

Sample SQL Syntax
1
2
3
4
SELECT * FROM Table1
INNER JOIN Table2
ON Table1.ID = Table2.ID
WHERE Col1 LIKE 'foo'

Unluckily, when the size of Table1 and Table2 is large, it takes a while to get the result.

Solution

This page has two more efficient ways. Since I search for recent data, I adopted the third method in my query.

My Query on Stack Exchange Data Explorer
1
2
3
4
5
6
7
8
9
10
11
DECLARE @TagLike NVARCHAR(25) = ##taglike:string##

SELECT TOP 500 * FROM (SELECT Id AS [Post Link], AnswerCount AS [Ans],
CommentCount AS [Com], CreationDate, Score AS [Scr],
ViewCount AS [Views], OwnerUserId FROM Posts
WHERE AnswerCount = 0 AND Tags LIKE '%' + @TagLike + '%' AND
ClosedDate IS NULL) AS p
INNER JOIN (SELECT Id, LastAccessDate, Reputation AS [Rep] FROM Users
WHERE LastAccessDate >= '2015-12-01') AS u
ON p.OwnerUserId = u.Id
ORDER BY p.Com

Distribution of User Reputation on Math Stack Exchange

| Comments |

Background

Recently, I post math on Mathematics Stack Exchange instead of here.

Problem

How can one get a table for the distribution of reputation on that site?

Solution

Write a SQL query on Stack Exchange Data Explorer.

User's Total Reputation Distributionlink
1
2
3
4
5
6
7
8
9
10
11
12
13
14
15
16
17
18
19
20
21
22
23
24
25
select u.range as [prev row <= Reputation <= this row], count(*) as [Users]
from (
    select case
    when Reputation between 1 and 4 then 4
    when Reputation between 5 and 9 then 9
    when Reputation between 10 and 14 then 14
    when Reputation between 15 and 19 then 19
    when Reputation between 20 and 49 then 49
    when Reputation between 50 and 74 then 74
    when Reputation between 75 and 99 then 99
    when Reputation between 100 and 124 then 124
    when Reputation between 125 and 249 then 249
    when Reputation between 250 and 499 then 499
    when Reputation between 500 and 999 then 999
    when Reputation between 1000 and 1999 then 1999
    when Reputation between 2000 and 2499 then 2499
    when Reputation between 2500 and 2999 then 2999
    when Reputation between 3000 and 4999 then 4999
    when Reputation between 5000 and 9999 then 9999
    when Reputation between 10000 and 14999 then 14999
    when Reputation between 15000 and 19999 then 19999
    when Reputation between 20000 and 24999 then 24999
    else 400000 end as range
        from Users) u
    group by u.range

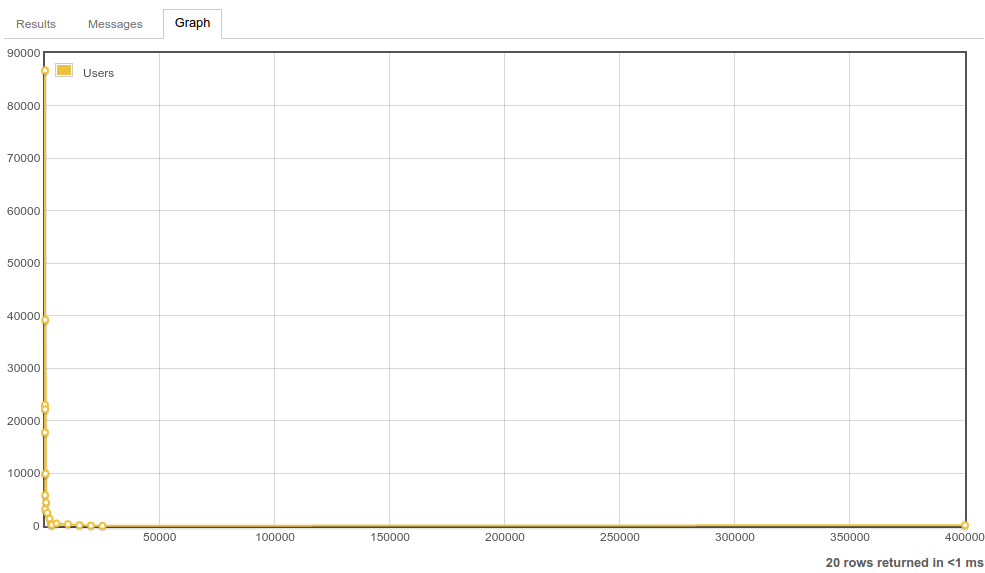
The indentation is automatically done by Vim. I know that the syntax is ugly. If I assign text string to the column u.range, then the table is sorted in alphabetical order of that column instead of numerical order. This doesn’t make sense. Therefore, I use a dirty way to get the statistics, and played with the built-in graphing function. However, the visual result isn’t so satisfactory.

MathSE reputation statistics

Anyone who has completed high school will realise that a log graph is better. Asking for this feature on Meta Stack Exchange takes time. I believe that such feature request will be rejected by the moderator to reduce the workload of Stack Exchange company. Therefore, I plot the log graph using GNU Octave.

  1. Download the CSV file to get the data.
  2. Change it to an GNU Octave script file.
  3. Open it using Vim.
  4. Do the necessary text substitutions so that the data becomes a matrix.
  5. Complete the script file by adding the plot commands.
The source code for the log plot (mathse-rep.m) download
1
2
3
4
5
6
7
8
9
10
11
12
13
14
15
16
17
18
19
20
21
22
23
24
25
26
27
28
A = [
4,86698;
9,23074;
14,17793;
19,9897;
49,22201;
74,5852;
99,3187;
124,39216;
249,9960;
499,4471;
999,2496;
1999,1416;
2499,319;
2999,223;
4999,482;
9999,356;
14999,155;
19999,81;
24999,45;
400000,152];
loglog(A(:,1), A(:,2), ".-k");
for i = 1:numel(A(:,1))
  text(A(i,1), A(i,2), ['(' num2str(A(i,1)) ',' num2str(A(i,2)) ')'], ...
  "fontsize", 12);
end
title("User's Total Reputation Distribution on Math Stack Exchange", ...
"fontsize", 14);

I choose loglog because semilogx causes the labels on tail to overlap. Here’s the results.

</source> Target log graph

Lessons learnt

I can save plots in GNU Octave as a SVG file. I know this after searching “octave export svg”. From Printing and Saving Plots, I see print -d[device], in which one can substitute the output format. For example, I used print -dsvg to generate the SVG’s shown above.

Ubuntu Grey Screen

| Comments |

A few days ago, I was browsing questions on Mathematics Stack Exchange on Ubuntu 14.04 LTS. I opened lots of tabs in Google Chromium. Suddenly, the screen went grey. I don’t know the cause. I hadn’t seen such problem before. I waited for about one minute, and I switched to the terminal tty3. The grey screen became black without any text. I pressed <Ctrl>-<Alt>-<F7>, then the monitor showed the grey screen again.

I looked at the light (not the power button) in the desktop. I thought it represented the hard disk activity. Its blinking was normal. As a result, I guessed the problem was related to the display. I pretended I could normally see things, and I imagined the picture. I logged on tty3 without logging off tty7. Then I typed sudo reboot and supplied the password. Within several seconds, I heard a beep sound and the system rebooted.

Certainly, all unsaved works on tty7 had been lost. Therefore, it was very important to save your work. As I’m no longer an IT worker, I won’t try to find a solution after reading a few related posts which I have difficulty to understand. Within six months, a new LTS version of Ubuntu will be launched. The price of a SSD will drop, so perhaps I will clean install Ubuntu on a SSD.

Got a Warning From Octave

| Comments |

Background

To verify the inequality

\[ \left(\sqrt{\frac{a+b}{c}}+\sqrt{\frac{b+c}{a}}+\sqrt{\frac{c+a}{b}} \right)^2\ge\frac{16}{3(a+b)(b+c)(c+a)} \]

found on Math Stack Exchange, I wrote the following Octave script.

A small script to verify the inequality (test.m) download
1
2
3
4
5
a = 0.1; b = 0.2; c = 1 - a - b;
A = ((a+b)*(b+c)*(c+a))^(1/3)
B = (a*b*c)^(1/3)
C = (sqrt((a+b)/c) + sqrt((b+c)/a) + sqrt((c+a)/b))^2
16/(3*A^3)

Problem

The above script did the calculations, but a warning message appeared.

$ octave -q test.m
warning: function ./test.m shadows a core library function
A =  0.60000
B =  0.24101
C =  31.975
ans =  24.691

How can I run this script without the warning?

Display of Calligraphic Font by MathJax in Chromium

| Comments |

Background

CSS style of this blog

I use Solarized theme with light background. IMHO, it is less tiring to look at a light background. I’ve chosen pink as the text colour.

Contents of this blog

Apart from technical stuff, I often post math containing calligraphic font, for example

  1. Injectivity of Stable Mappings
  2. Definition of Content 0 Sets
  3. Archimedean Sequence of Partitions of a Square
  4. Composition of Limits

I used Mozilla Firefox, and I didn’t see problem on the display of \mathcal.

Problem

Three months ago, I wrote something about Zorn’s Lemma and Hausdorff spaces. In the post Normal Compact $T_2$ Spaces, I observed that the math display was abnormal. Due to homework and exams, I delayed the investigation into this technical problem.

mathcal display error

Normally, the foreground colour of the math expression is the same as that of normal inline text. In the above figure, "$T_2$" is in pink. However, $U_y, V_y$ aren’t.

Residue at Infinity

| Comments |

In the derivation of the formula

\[ \Res_{z=\infty} f(z) = -\Res_{z=0} \left [ \frac{1}{z^2} f \left ( \frac{1}{z} \right) \right ], \]

I didn’t know why the factor $\dfrac{1}{z^2}$ was needed. Luckily, googling the title of this post, I quickly found two posts on Mathematics Stack Exchange about the intuition behind.1

In fact, this factor appears when we make the substitution $z \mapsto \dfrac{1}{z}$. For any simple closed contour $C$ and a complex-valued function $f$ which is analytic at the interior points of the region bounded by $C$ except for finitely many points,

\[ \int_C f(z) \ud z = -\int_C \frac{1}{z^2} f \left ( \frac{1}{z} \right) \ud z. \]

$\rm \LaTeX$ Template for Simplex Tableaux

| Comments |

Goal

To provide a good-looking template of simplex tableaux for users of Mathematics Stack Exchange.

\[ \begin{array}{crrrrrrr|l} & x_1 & x_2 & x_3 & x_4 & x_5 & x_6 & x_7 & \\ \hline x_4 & 0 & -3 & 7 & 1 & 0 & 0 & 2 & 2M -4 \\ x_5 & 0 & -9 & 0 & 0 & 1 & 0 & -1 & -M -3 \\ x_6 & 0 & 6 & -1 & 0 & 0 & 1 & -4^* & -4M +8 \\ x_1 & 1 & 0 & 1 & 0 & 0 & 0 & 1 & M \\ \hline & 0 & 1 & 1 & 0 & 0 & 0 & 2 & 2M \\ \text{ratio} & & & 1 & & & & 1/2 & \end{array} \]

Learnt Laurent Series

| Comments |

Yesterday, I read the proof of Laurent’s Theorem in my complex variables book, and I was stuck at the following equation.1

Suppose that $f$ is analytic on the annular region $R_1 < \abs{z - z_0} < R_2$. Let $C$ be any postively-oriented closed curve surrounding point $z_0$. By Cauchy–Goursat Theorem, we have

\[ f(z) = \sum_{n = -\infty}^{\infty} c_n (z - z_0)^n \quad (R_1 < \abs{z - z_0} < R_2). \]

Image size: 300

Your browser does not support SVG

Valid SVG 1.1

Source code: $\rm \LaTeX$, SVG

I was stuck at this point.

\begin{equation} \int_{C_2}^{} \frac{f(s) \ud s}{s - z} - \int_{C_1}^{} \frac{f(s) \ud s}{s - z} - \int_{\gamma}^{} \frac{f(s) \ud s}{s - z} = 0 \label{int} \end{equation}

The function $f$ is analytic on the entire circle $\gamma$, including the circumference of $\gamma$. Then the boundary of the region where $f$ is analytic is the circumferences of $C_1$ and $C_2$. I wondered why the third term in $\eqref{int}$ was needed. I took me half an hour to figure out that the integrand is not simply $f(s)$, but with a denominator $s - z$. Since $z$ is the centre of the circle $\gamma$, I need to also include it as the boundary of the region of analyticity of the integrand.


  1. Brown, J. W., Churchill, R. V., & Lapidus, M. (1996). Complex variables and applications (Vol. 7). (pp. 17). New York: McGraw-Hill.